AWS Public Sector Blog
Improve road safety by analyzing traffic patterns with no-code ML using Amazon SageMaker Canvas

Artificial intelligence (AI) and machine learning (ML) technologies are revolutionizing the way businesses operate across various industries, including the public sector. AI and ML empower transportation agencies to extract valuable insights from their raw data collected using IoT devices like sensors and cameras, enhancing the quality of services. These technologies enable transportation and other government agencies to enhance the experience of constituents and provide cost-effective transportation and mobility solutions.
To improve safety and convenience, transportation agencies amass a substantial volume of data on road incidents, traffic patterns, weather-related events, vehicle defects, and more. However, these organizations encounter challenges in data accuracy validation due to issues related to data quality and occasional missing information. With the incorporation of new AI/ML capabilities from Amazon Web Services (AWS), they can take advantage of no-code solutions to identify and address data gaps. Additionally, they can utilize predictive mechanisms to identify traffic patterns and reduce traffic incidents such as vehicle pile-ups, crashes, or driving hazards caused by bad road conditions. With deep visibility and the potential of AI/ML-powered business intelligence, they can conduct thorough analysis of actionable data patterns, ultimately making roads safer and more secure to navigate.
Prerequisites
For this solution, make sure you have completed the following prerequisites:
- Access to an AWS account with appropriate permissions to access below services using the AWS Identity and Access Management (IAM) role.
- Download the transportation dataset to your local machine.
- Access to an Amazon SageMaker Canvas subscription.
- Access to an Amazon QuickSight subscription.
- Access to Amazon Simple Storage Service (Amazon S3) bucket for uploading the dataset.
Solution overview
In this blog post, we discuss how transportation organizations can analyze the factors contributing to road accidents and predict accident severity using Amazon SageMaker Canvas no-code capability. All the data used for the analysis is publicly available without any PII or other protected customer info. The insights generated will enable organizations to formulate impactful preventive strategies and elevate the overall safety standards on the road. SageMaker Canvas supports foundation models (FMs) from Amazon Bedrock, including Claude, Amazon Titan, and Jurassic, and public models from Amazon SageMaker JumpStart, such as Falcon and MPT. Using these models in SageMaker Canvas allows you to generate actionable prediction models with high accuracy.
This solution comprises the following steps:
- Import the raw transportation dataset in SageMaker Canvas using Amazon S3: Road Traffic Accidents dataset.
- Run exploratory data analysis on the imported dataset using SageMaker Canvas.
- Perform feature filter and validation for the dataset.
- Train and build the ML model.
- Run predictions against the ML model using SageMaker Canvas.
- Share the insights generated by the ML model with business stakeholders using QuickSight.
The following diagram illustrates the solution architecture.
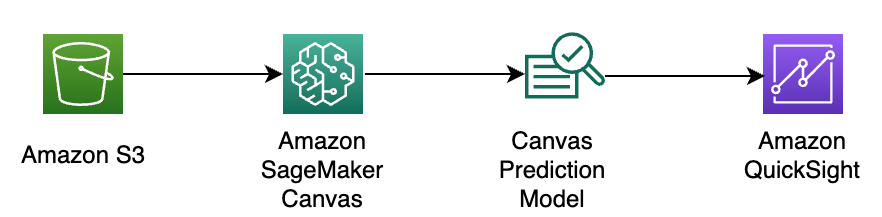
Figure 1: Architectural diagram of the solution described in this blog. The major components are an Amazon S3 bucket, SageMaker Canvas, and QuickSight.
Solution walkthrough
For this blog post, we use a publicly available dataset from Kaggle. This dataset is collected from Addis Ababa (Ethiopia) Sub city police departments for research work and was prepared from manual records of road traffic accidents from 2017 to 2020. All the sensitive information was excluded during data encoding, resulting in 32 features and 12,316 instances of road accidents.
Import the dataset to SageMaker Canvas
As a first step, download the transportation research dataset to your local machine. Upload the dataset to the S3 bucket in your AWS account and enable access to the bucket for SageMaker Canvas. Complete the following steps:
- On the Canvas console, in the navigation pane, choose Datasets.
- Choose Create. Select the Tabular dataset and enter the dataset name in the dialog box, as shown in Figure 2.

Figure 2. Screenshot of the SageMaker Canvas tabular dataset dialog box for import configuration.
- Choose the dataset file that you have uploaded to Amazon S3. Once you upload your dataset to Amazon S3, you can preview your dataset. Shown in Figures 3 and 4.

Figure 3. Screenshot of SageMaker Canvas when choosing a dataset file to import from S3 bucket.
- Next, select the dataset and choose Create a dataset. The build tab will open, where you can start exploring your data.

Figure 4. Screenshot of SageMaker Canvas showing an import preview of a selected dataset.
Run exploratory data analysis
Before you can start building your model, it is very important to perform exploratory data analysis (EDA), which can help you gain a deep understanding of your dataset. It allows you to familiarize yourself with the data’s structure, feature distribution, characteristics, patterns, relationships, and dependencies within the data. It helps you identify and address data quality issues such as missing values, outliers, duplicates, and noisy data. Cleaning and preprocessing the data are essential steps for building robust ML models.
SageMaker Canvas allows business analysts, data scientist and others to apply data transformations using a visual interface. Removing data outliers and replacing missing values with imputed values are some examples.
As you can see from our dataset, there are many features that have missing data (Figure 5). If a prediction model is built using these features, the model will not be accurate. Missing values in a dataset can have a significant impact on model training and can lead to various issues. One option to deal with missing values in your dataset is to remove the affected rows or columns, but this can result in a loss of valuable data, especially if the missing values are not missing completely at random. Deleting data can reduce the effective sample size, potentially reducing the statistical power of your model and making it less representative of the true population.

Figure 5. SageMaker Canvas screenshot showing missing data for the selected dataset.
Another option is to use appropriate imputation techniques to fill in missing values. Common imputation methods include mean, median, mode imputation, and more advanced techniques like regression imputation, k-nearest neighbor imputation, or predictive modeling–based imputation. With SageMaker Canvas, you can easily apply a transform using a model recipe. You can choose the default mode (Automatic), which lets SageMaker Canvas replace missing values with imputed values that best fit your data. This imputation method is done automatically for each model build, unless you specify the Manual mode, which lets you specify the values to replace the missing data with.
Perform feature filter and validation of dataset
To predict the right outcome, it is very important that AI/ML models use the right set of data and features to train, analyze, and optimize the result . With SageMaker Canvas no-code configuration, customers can use the dataset feature filtration and validate any data outliers with a few steps on the console.
Using the SageMaker filter, we have identified the Number_of_vehicles_involved column containing data outlier values, shown in Figure 6. After applying the standard deviation value for most occurring values, we drop those rows to remove the outliers in the dataset.
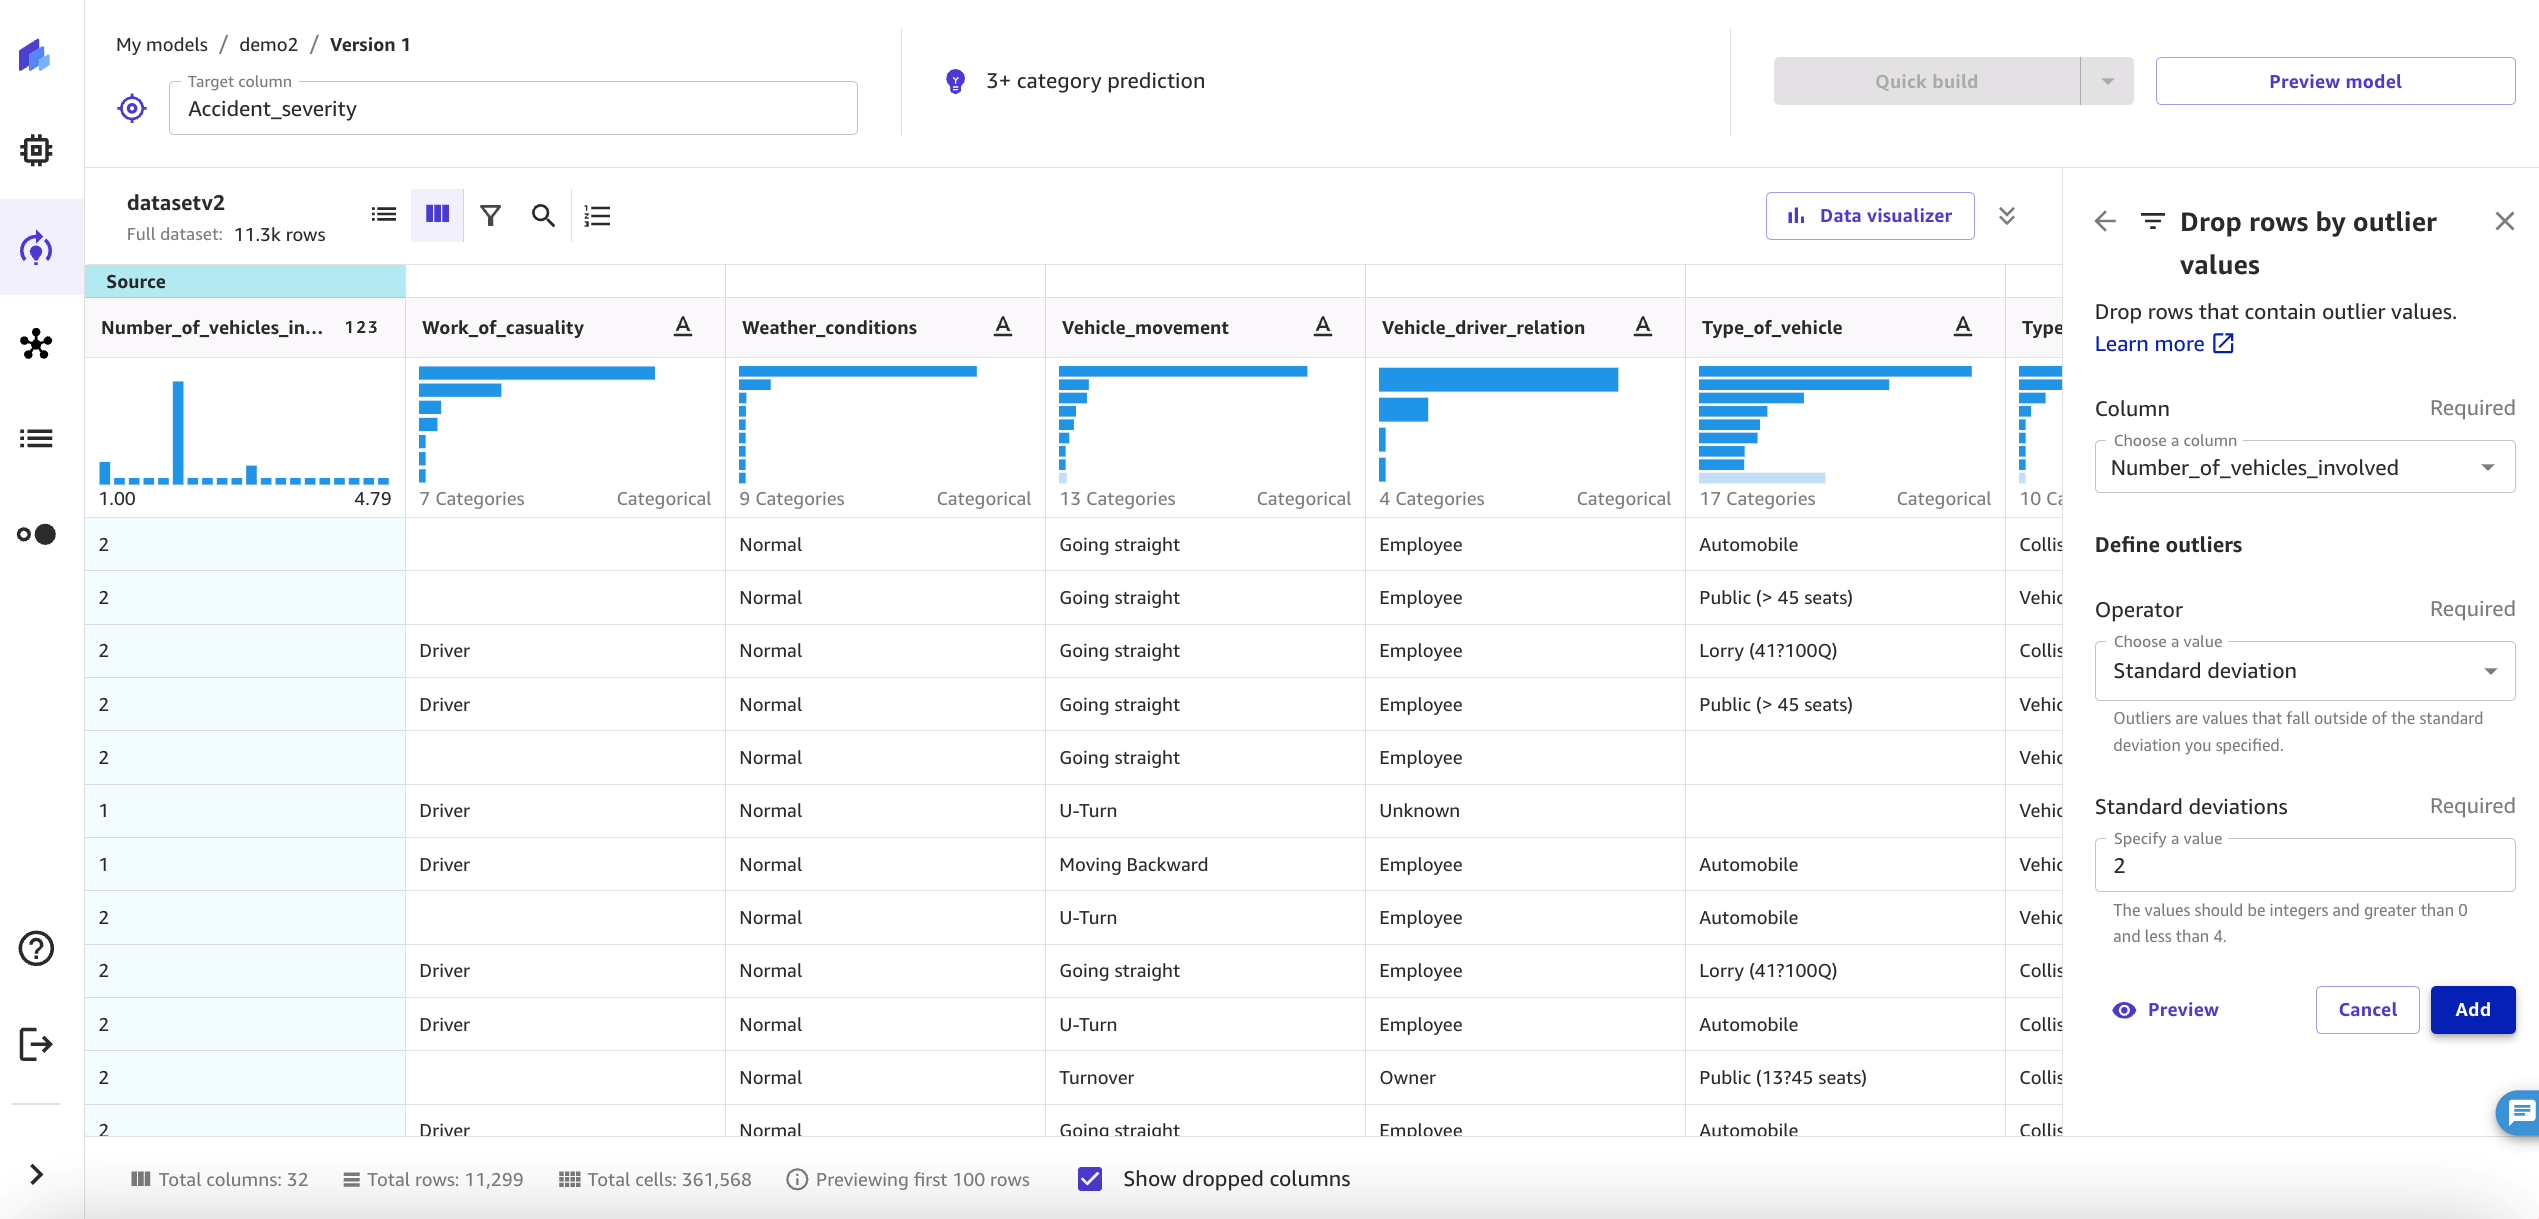
Figure 6. Screenshot of SageMaker Canvas showing a data filter for outliers and transformation in the Number_of_vehicles_involved column.
SageMaker Canvas automatically determines this is a categorization model with three categories. Because we are trying to predict accident severity, we use data analysis to identify Accident_severity as the target column to predict, shown in Figure 7. The model below provides a breakdown of accident severity with distribution values of slight injury, serious injury, and fatal injury based on the high impact data features available in the selected dataset.
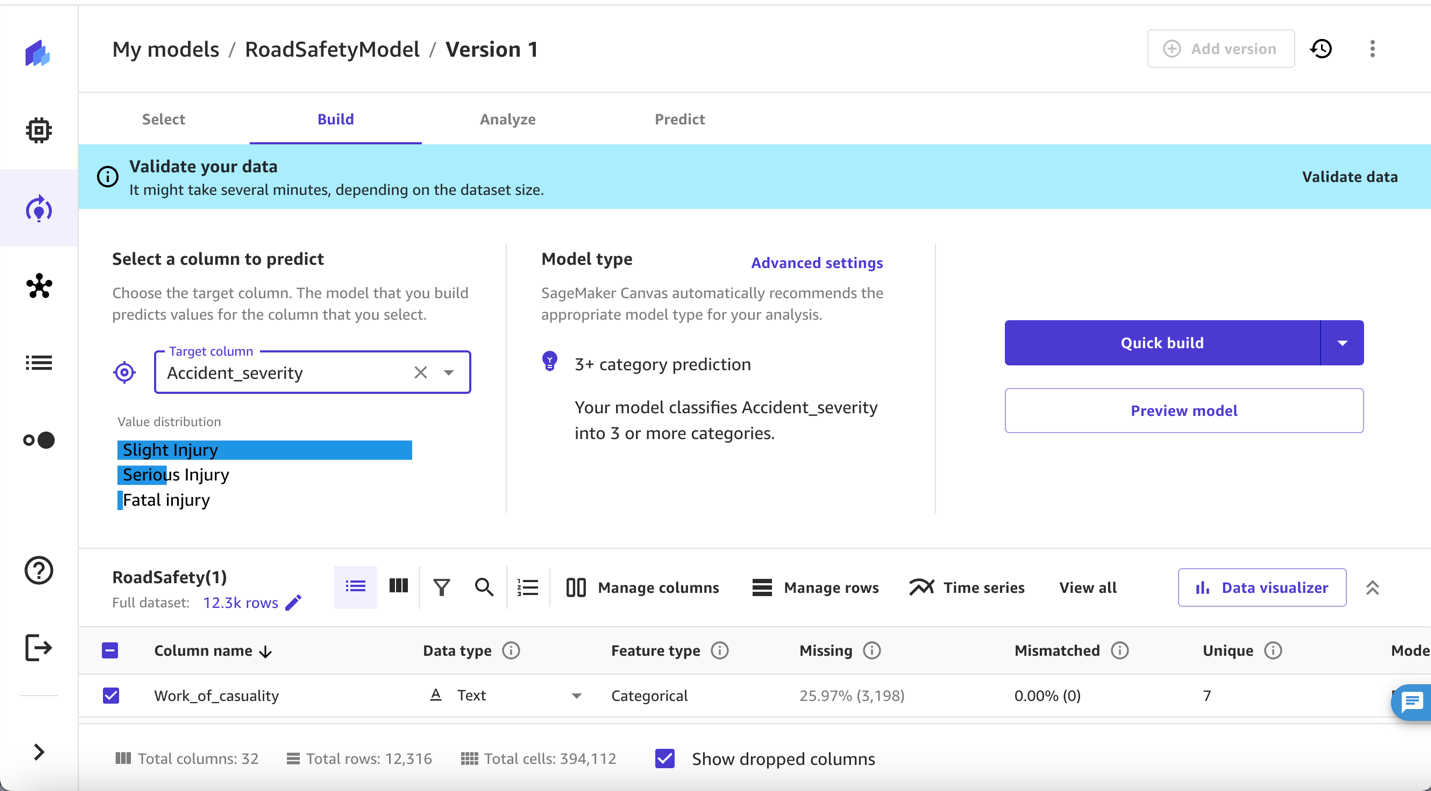
Figure 7. Screenshot showing the selection of a column (accident severity) to predict for the model described in this blog post.
You might notice that the dataset is highly unbalanced towards the Slight Injury class. ML algorithms often work best when they have an equal or near-equal number of examples for each class or category in the dataset. When the dataset is imbalanced, where one class significantly outnumbers the others, the model can result in reduced performance. While SageMaker Canvas and its underlying AutoML capabilities can partly handle dataset imbalance, you might want to balance your dataset before you bring the data to SageMaker Canvas. You can use the Balance data transformation available within Amazon SageMaker Data Wrangler to balance your dataset. For this post, we are proceeding with the imbalanced dataset to show that SageMaker Canvas can handle imbalanced datasets automatically.
After applying the filters as described in the preceding steps to transform the data, you can use the data validation capability within SageMaker Canvas to identify any issues within your dataset. By enhancing data quality, this feature enhances data reliability and usability while reducing training time by eliminating any potential issues, thereby adding value to the overall model prediction construction process. Figure 8 shows the data validation feature in SageMaker Canvas.

Figure 8. Screenshot of the SageMaker Canvas data validation feature.
Train and build ML model
Before you start training and building the ML model, make sure you have selected the predictor because it is the column that needs to be predicted. In our example, the Accident_severity column is the predictor.
For building the model, you have two options: Quick build and Standard build. A quick build model trains fewer combinations of models and hyperparameters in order to prioritize speed over accuracy. For this post, we choose Quick build. The model building process can take anywhere from 2–15 minutes, depending on factors such as input data size and complexity. Once complete, SageMaker Canvas automatically moves to the Analyze tab to show you the results of quick training. Figure 9 shows the model overview status screen in SageMaker Canvas.
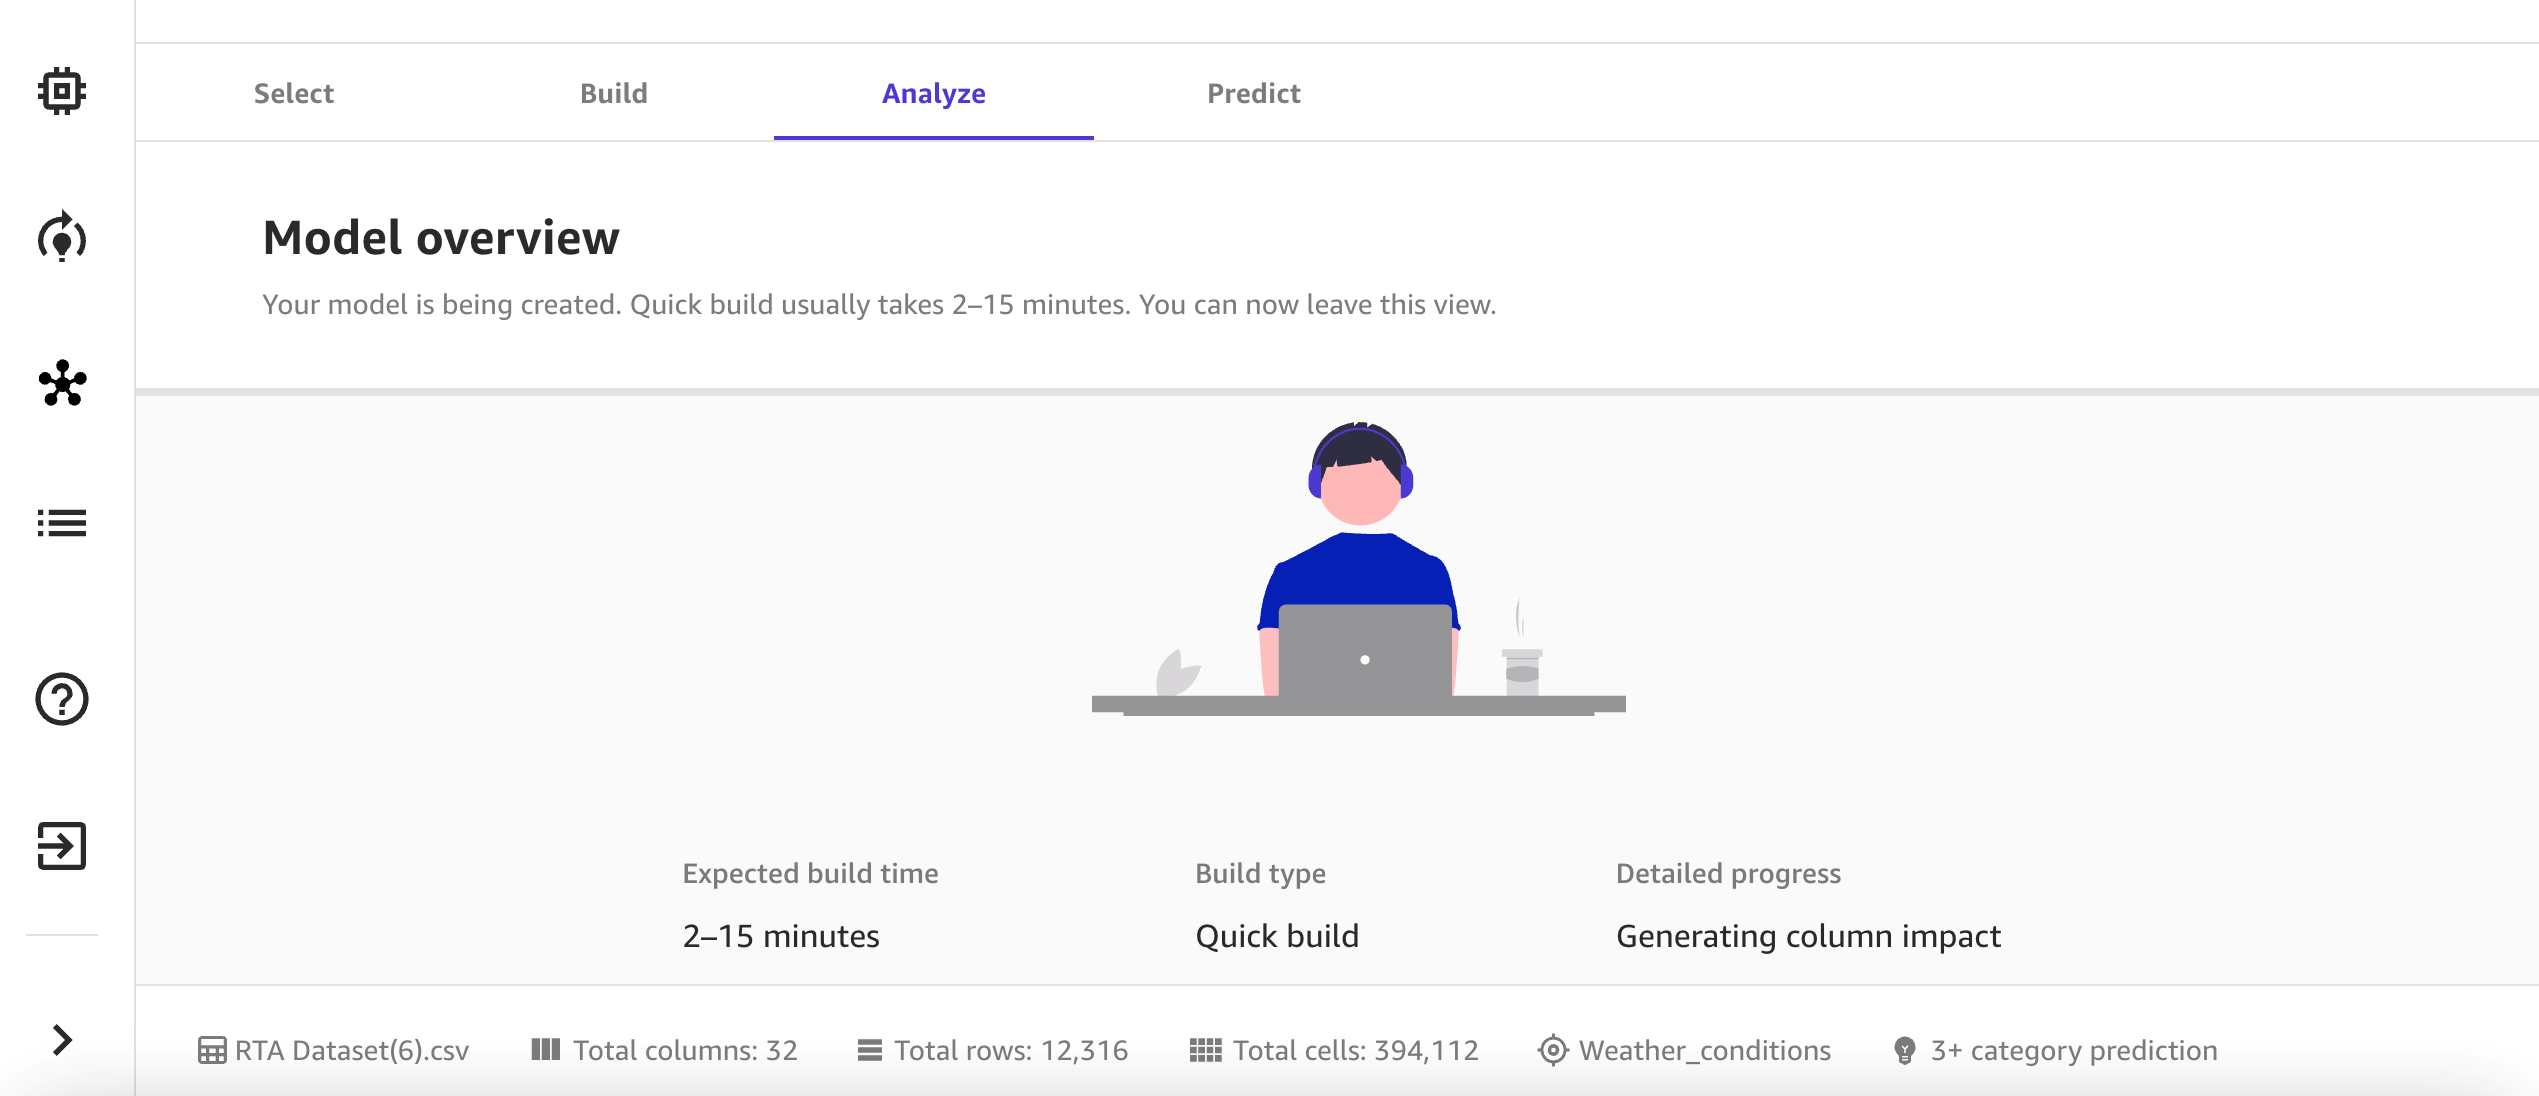
Figure 9. Screenshot of the SageMaker Canvas prediction model build overview, showing the expected build time, build type, and progress of the model being created.
Evaluate model performance
Shown in Figure 10, the analysis performed using quick build estimates that your model can predict the right severity type (outcome) 92.8 percent of the time.
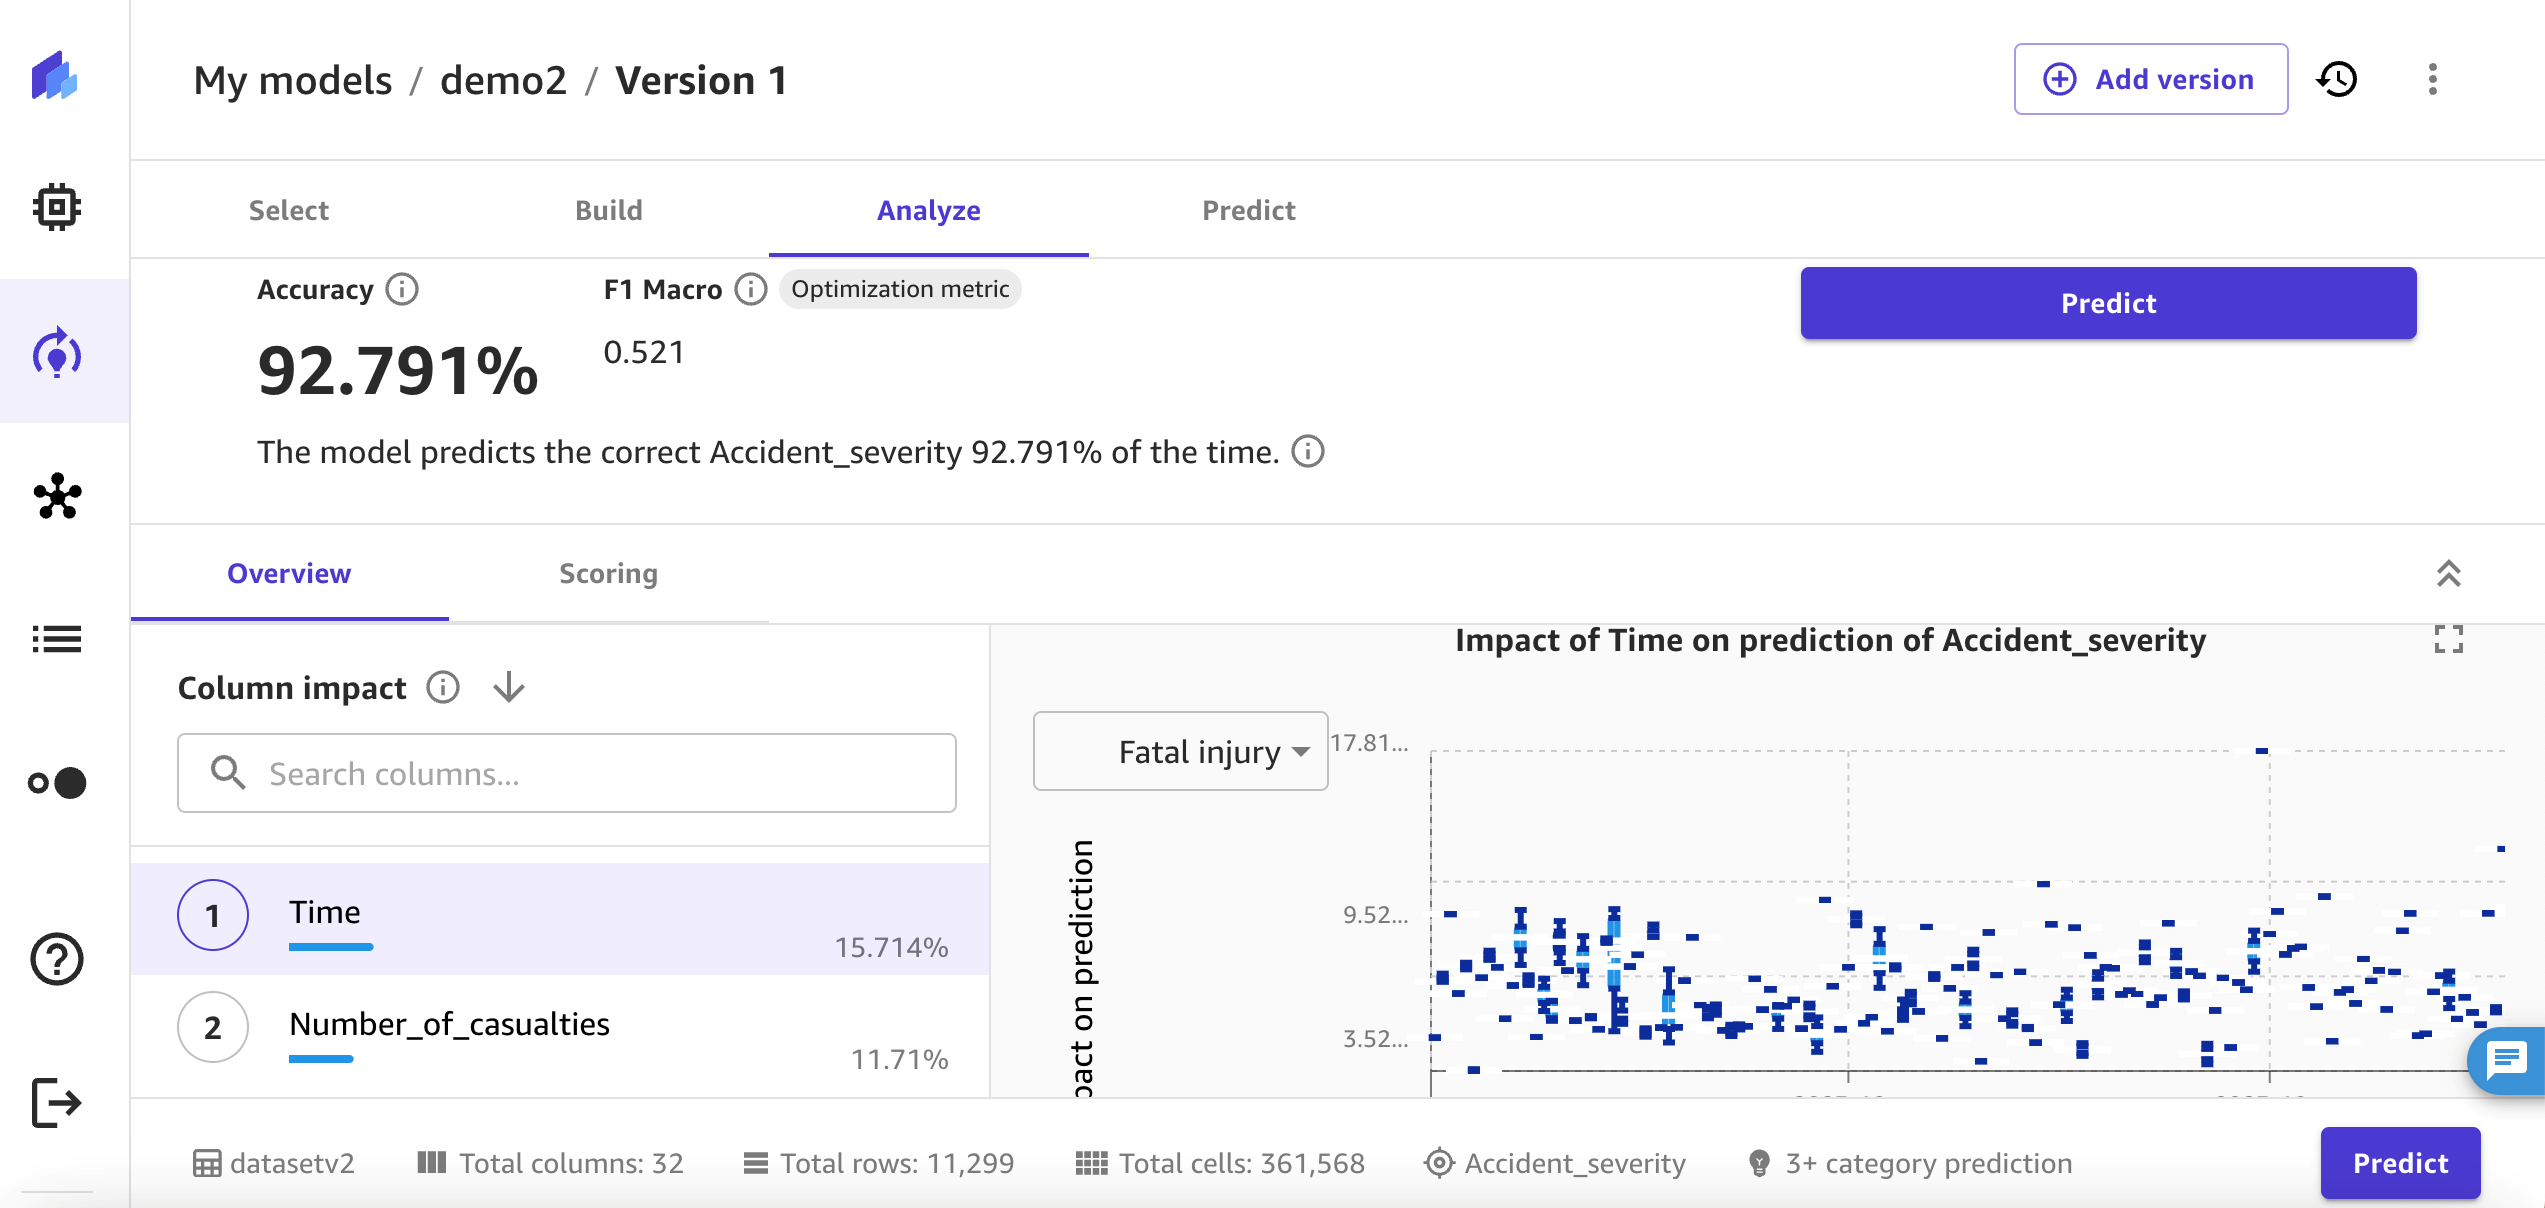
Figure 10. Screenshot of the SageMaker Canvas model generated after the analysis with Accident_severity with time of day. It predicts correct accident severity 92.791 percent of the time.
For model explainability, SageMaker Canvas provides column impact analysis, which explains the impact that each column in your dataset has on a model. You can see the column impact that identifies which columns have the most impact on each prediction. In this example, the time and number of vehicles involved have the most significant impact in predicting accident severity.
Figure 11 illustrates how the likelihood of fatalities increases over time within a given day. The model identifies a higher occurrence of fatalities during the morning peak hours, as depicted on the left of the figure. When integrating this predictive model data with additional factors, such as weather conditions and junction types, a more comprehensive action plan can be formulated to mitigate the risk of serious injuries and fatalities. This information can be instrumental in deploying the appropriate resources on the ground, informed by the data-driven predictions, to proactively prevent fatalities.

Figure 11. Model displaying the impact of the time of day on the prediction of accident severity.
The impact analysis can be run for each feature column. As another example, Figure 12 shows the impact of weather conditions on accident severity. With bad driving conditions due to weather, there is significant increase in fatal injury as predicted by the model below.
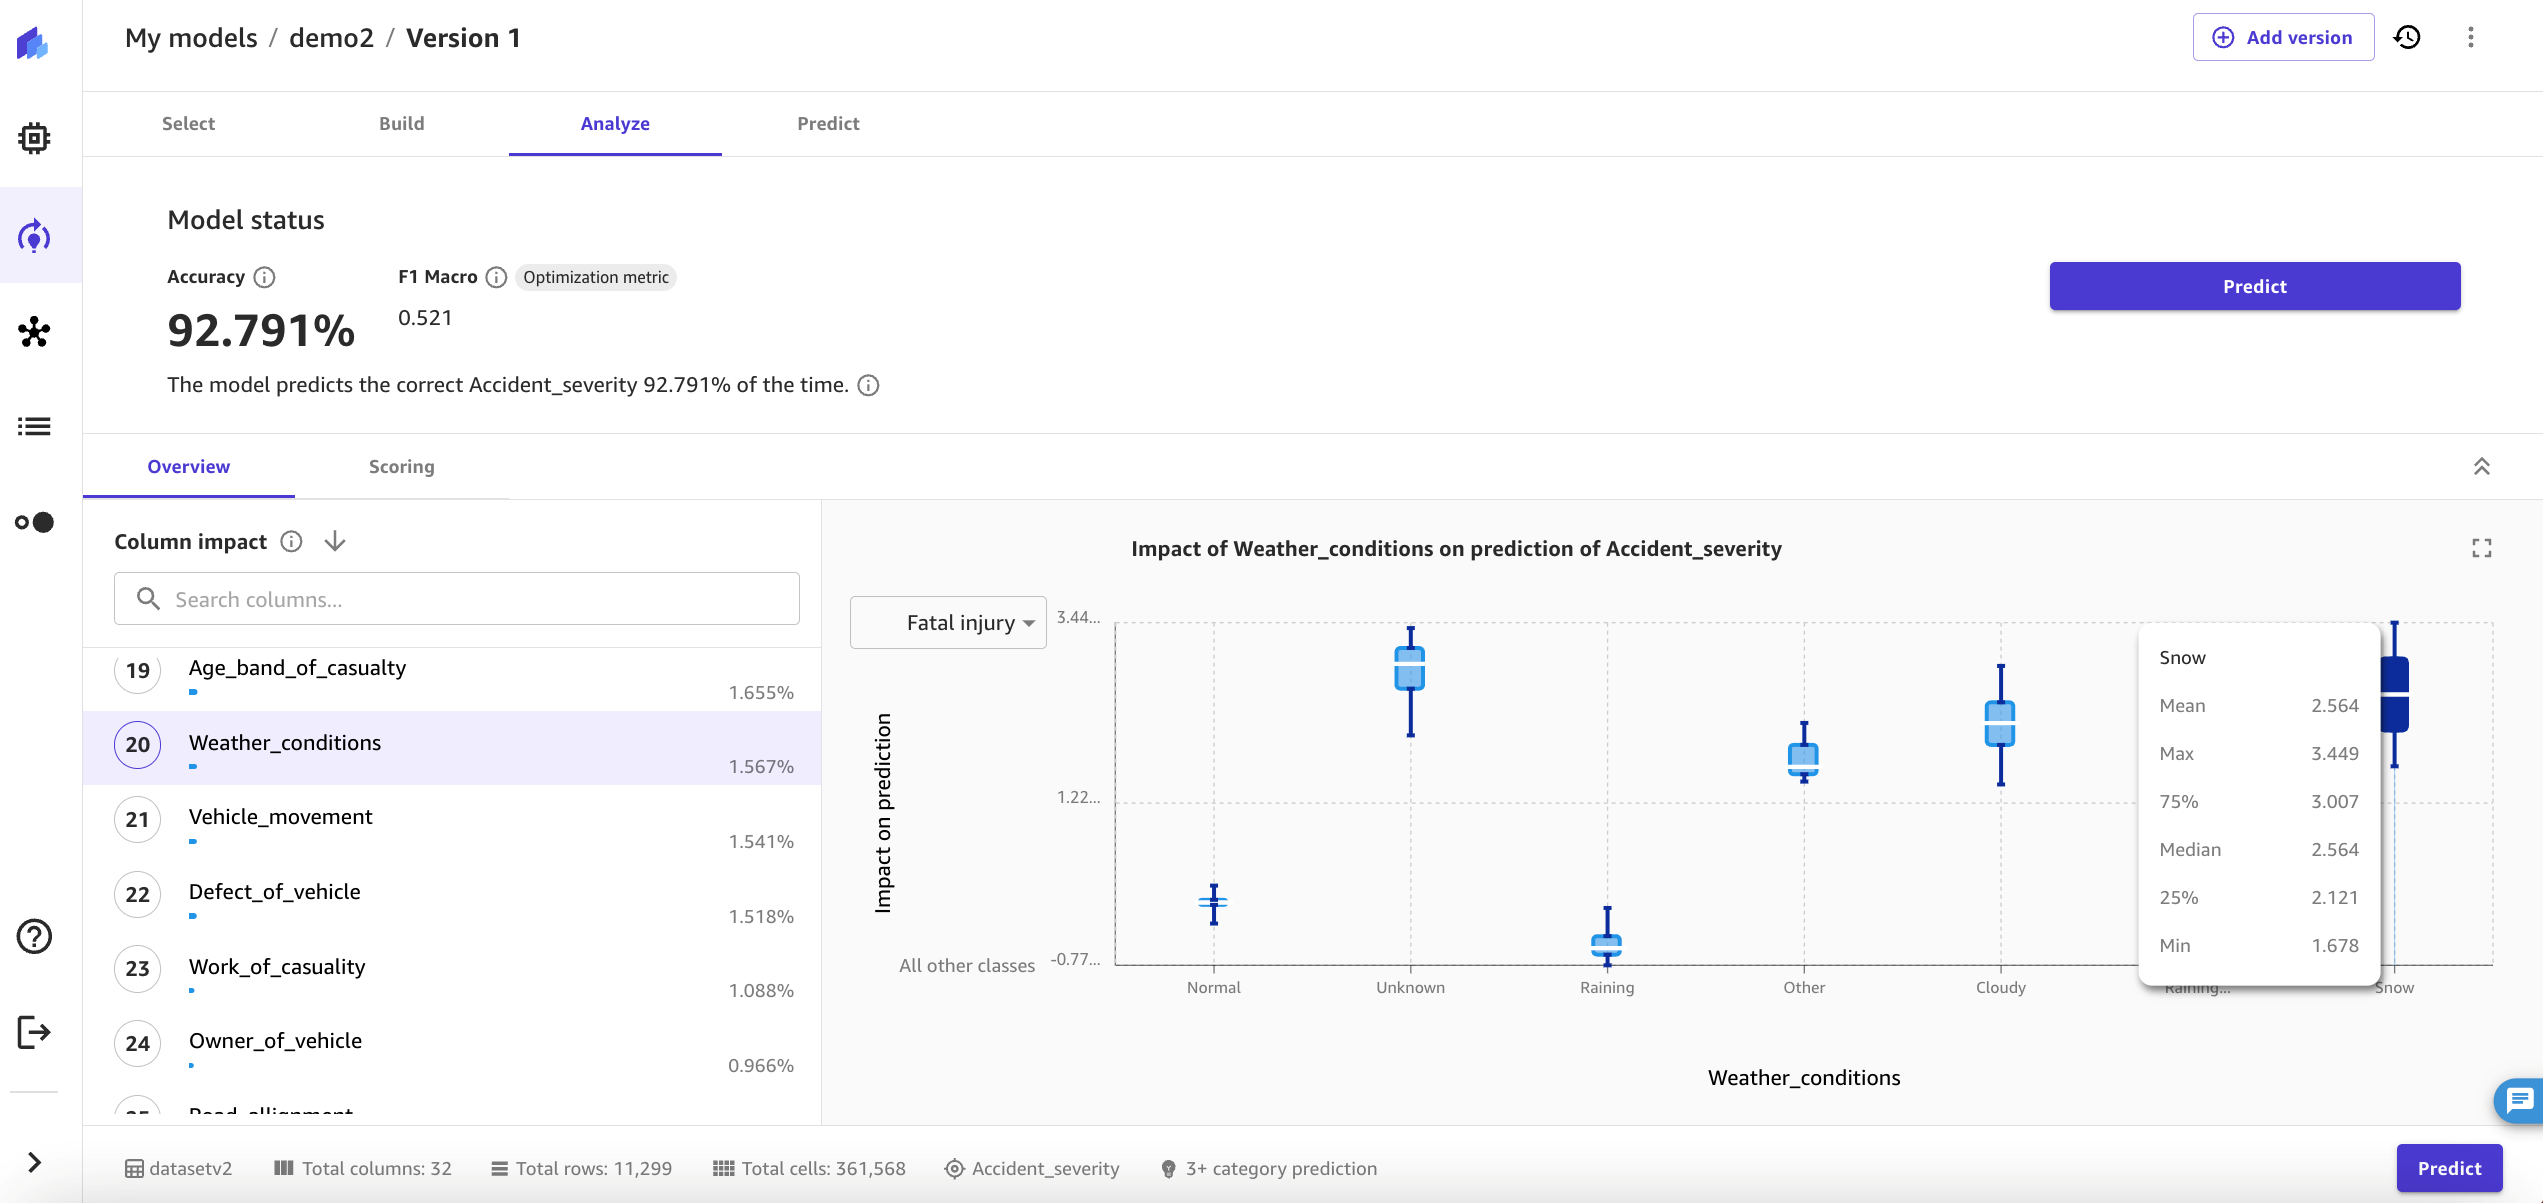
Figure 12. The model described in this blog predicts an increase in fatal injuries when adverse weather conditions such as snow are present.
Run predictions against the ML model
Once we’ve constructed our model, it becomes a valuable tool for forecasting severity when applied to fresh data. The results produced by this predictive model offer the means to devise a strategy for enhancing road safety. For instance, if we observe an increased frequency of accidents at a particular type of junction during a rainy morning rush hour, we can decide to lower the speed limit at that location and implement automatic speed cameras equipped with license plate recognition technology to issue speeding tickets.
We have two options for running the predictions:
- Batch prediction – You can run predictions in a batch by uploading your dataset and letting SageMaker Canvas use it for the prediction.
- Single prediction – In this option, you provide the values for a single accident. SageMaker Canvas will predict the severity for that particular accident.
Figure 13 shows an example of generating a single prediction based on the given input values of various features. The model predicted the severity as Slight injury with 99.3 percent prediction probability.
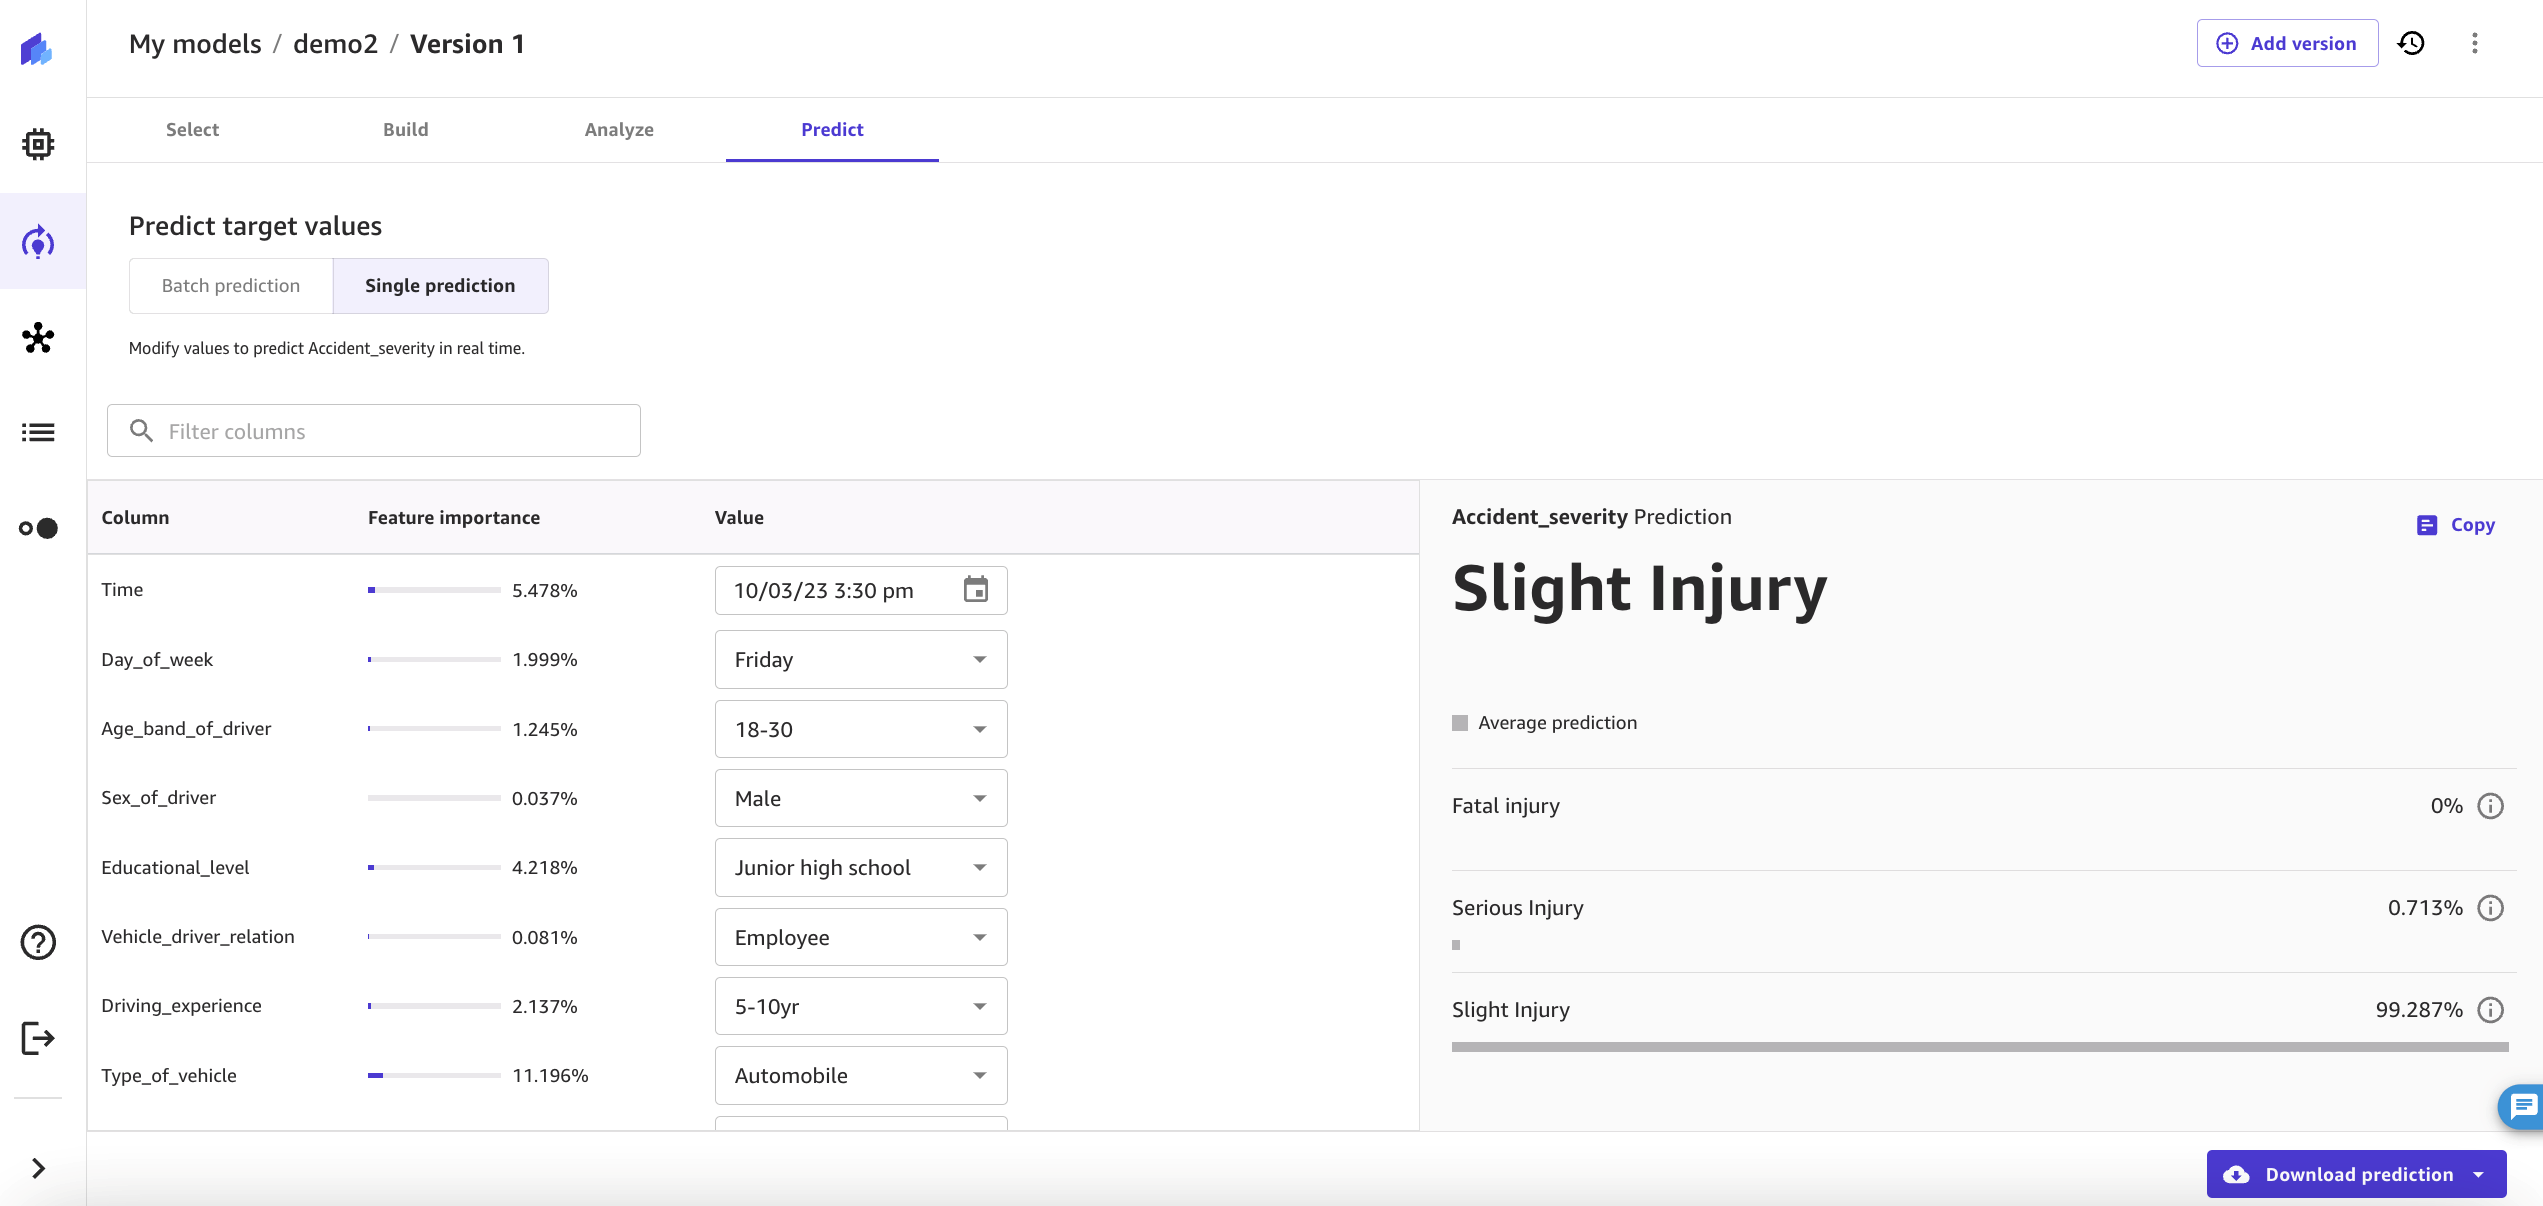
Figure 13. Screenshot showing a single prediction example based on input values of various features such as time of day and driving experience.
For this post, we use batch prediction to run predictions for multiple examples, and then export the generated dataset to QuickSight for deep analysis and report generation. Figure 14 shows the view for exporting from SageMaker Canvas to QuickSight.
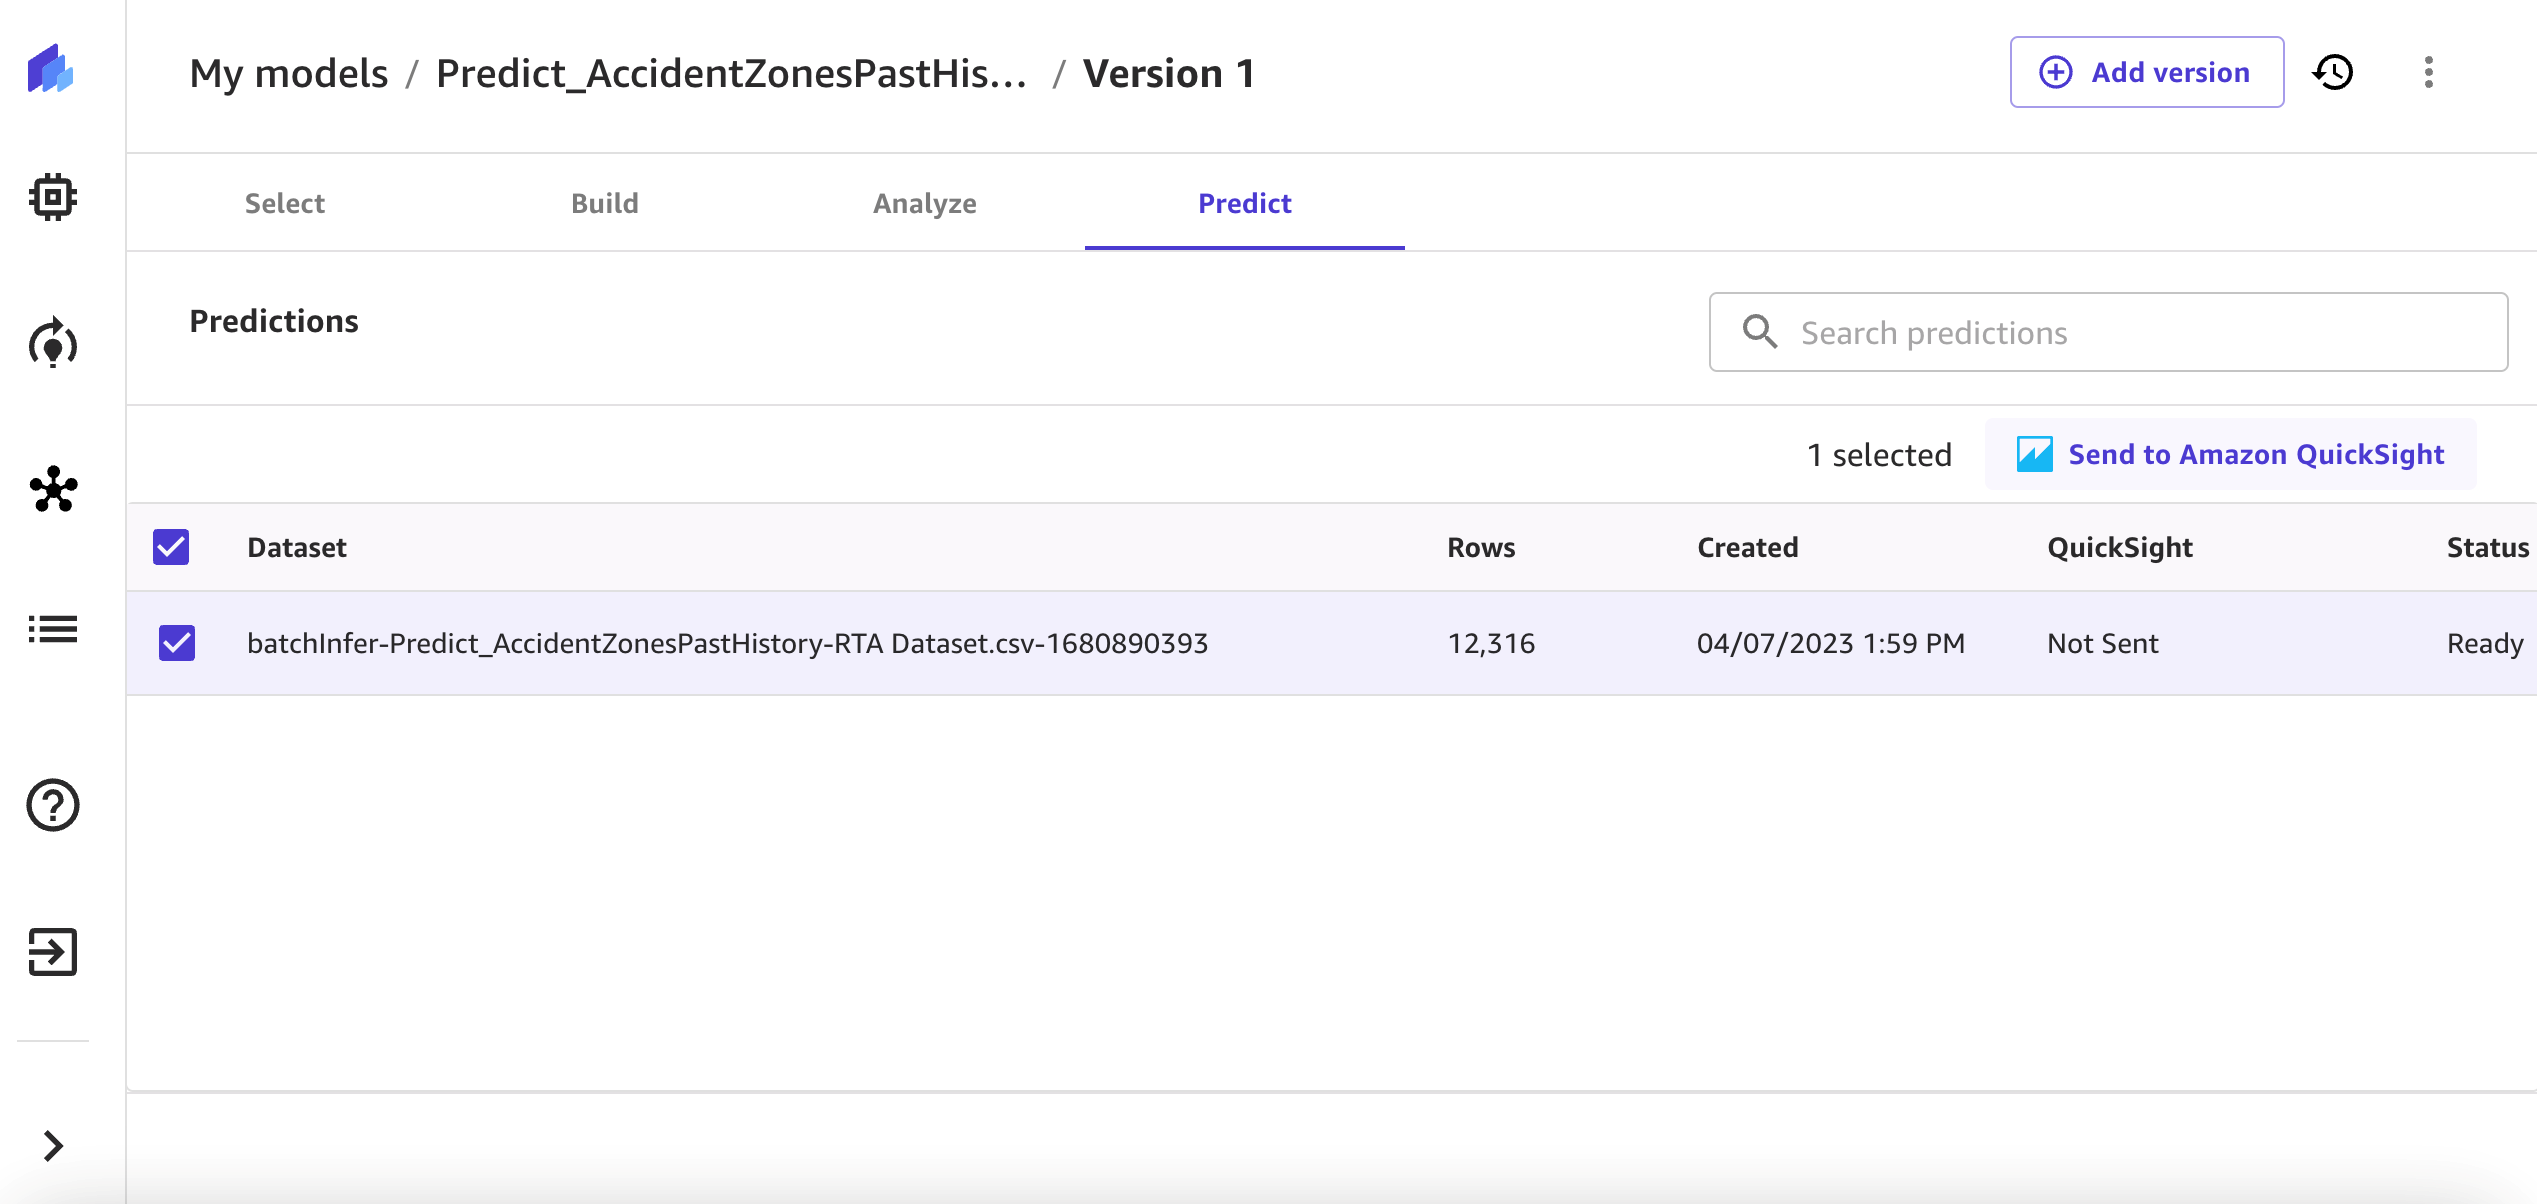
Figure 14. Screenshot of the SageMaker Canvas batch output dataset before it is sent to QuickSight for deeper analysis.
Share the insights generated by the ML model with business stakeholders using QuickSight
SageMaker Canvas easily integrates with QuickSight to provide deep visibility on the outcome of data model built on SageMaker Canvas with no-code feature. Customers can build or reuse pre-built dashboards, graphs, and charts with ML-enabled features on QuickSight. It also provides deep insight into data outliers with a grouping of data features and other dependent components within the QuickSight dashboards.
With Amazon QuickSight ML Insights capabilities, data search becomes quite easy and interactive for the users. Figure 15 shows the Type_of_vehicle feature grouped with the outcome of the model and the data distribution of Road_surface_condition and Types_of_junction.
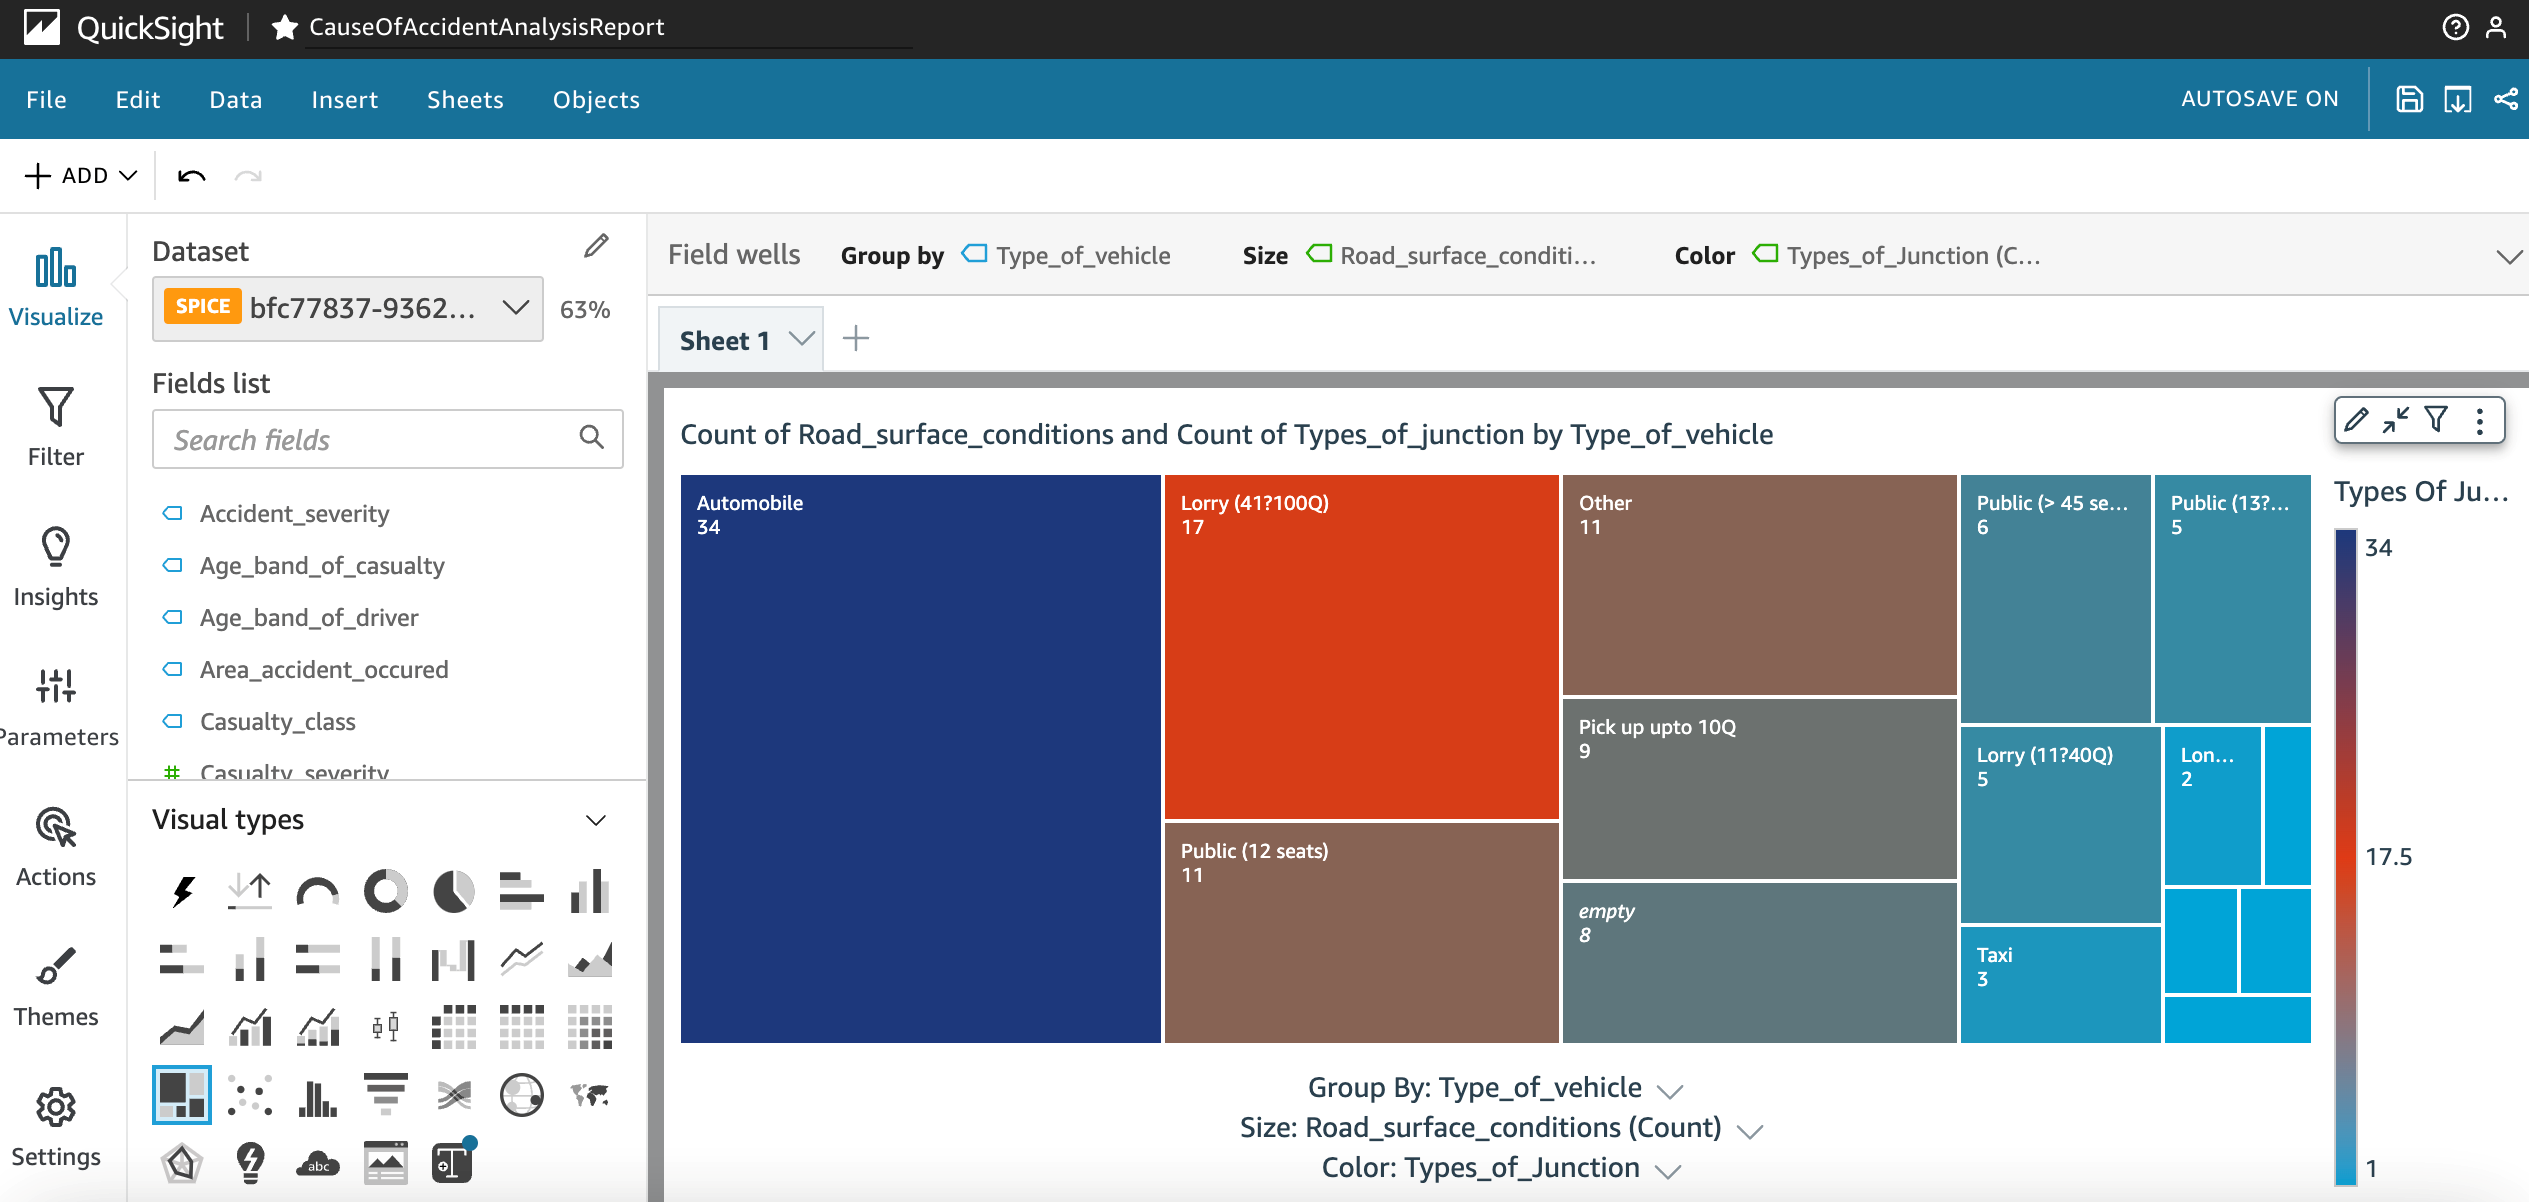
Figure 15. Screenshot of a QuickSight dashboard showing accidents caused by road surface conditions grouped by vehicle type.
Focus on a specific cause by exporting data for the selected filter from the QuickSight CauseOfAccidentAnalysisReport page. In Figure 16, the Focus only on Driving at high speed feature is selected to export the data for further action to reduce these types of incidents.
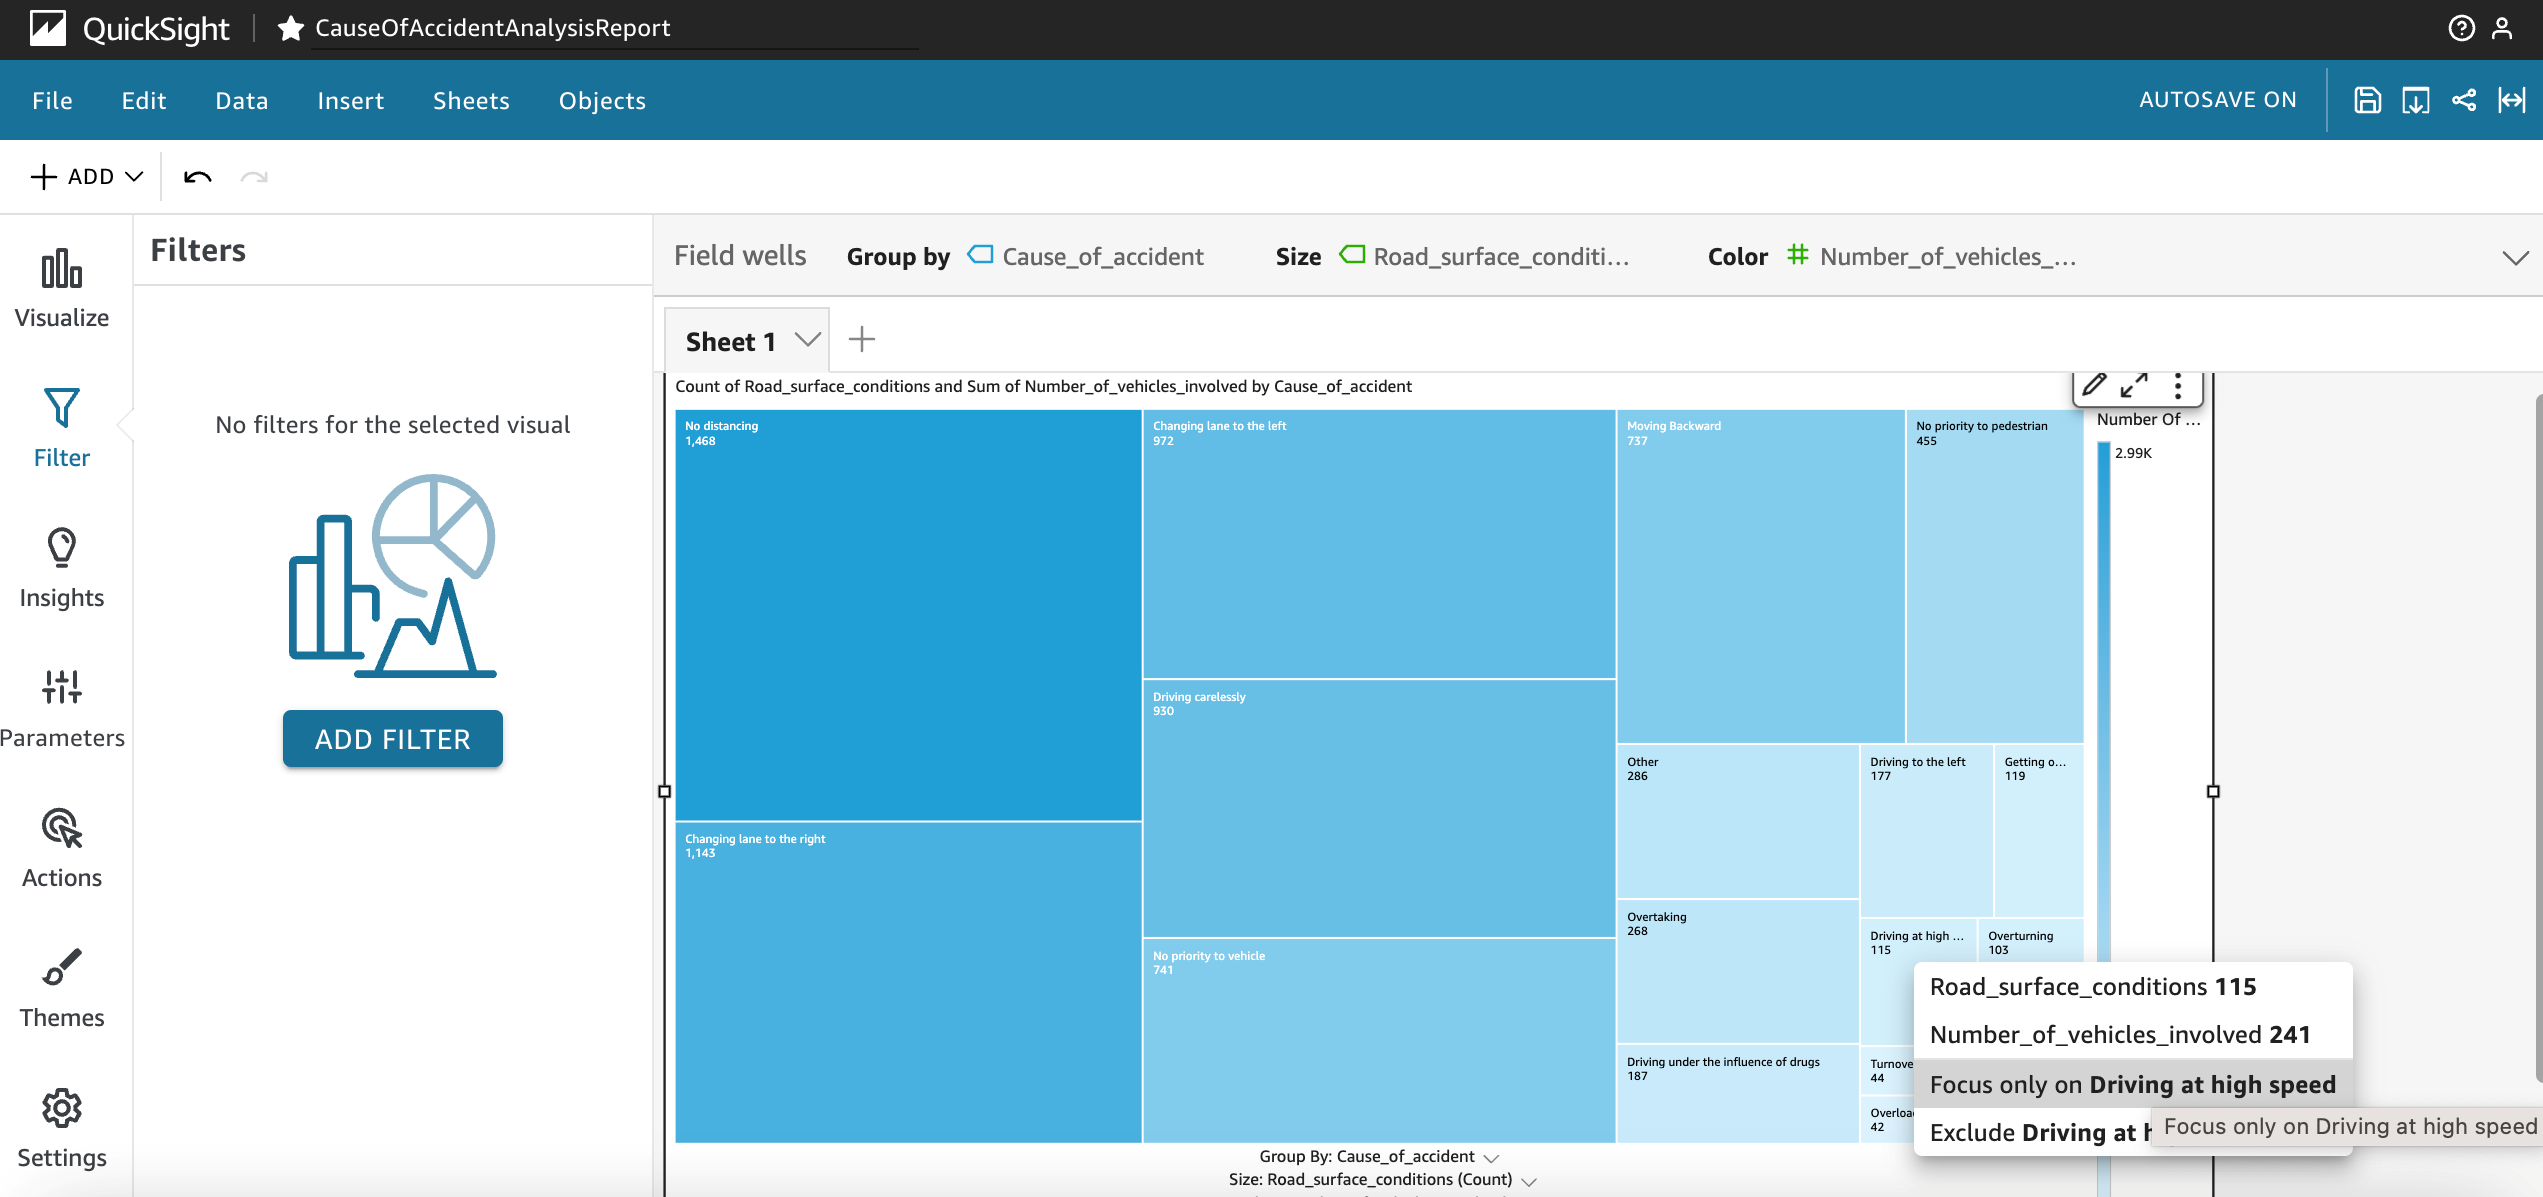
Figure 16. Screenshot of selecting a QuickSight filter for Focus only on Driving at high speed for actionable data export.
Conclusion
In the rapidly evolving landscape of AI and ML, organizations often face challenges in swift adoption. Various obstacles, such as acquiring the necessary skills, building models, configuring model parameters, and implementing best practices for AI/ML, as well as data preparation and feature selection, can lead to delays.
In this post, we showed how using a no-code solution like SageMaker Canvas allows customers to promptly analyze their existing datasets and generate ML-powered predictions for their specific needs. With SageMaker Canvas, customers can take advantage of pre-built models that don’t require an extensive understanding of ML models, enabling ML predictions on their datasets with ease.
Get started and learn more about SageMaker Canvas with the following resources: